The Metrics section of cPanel shows who visits your site, how much data it uses, and any errors. Open cPanel from the Client Area (Services > My Services, open your hosting service, then Log in to cPanel) and scroll to Metrics.
Visitors
Shows up to the last 1,000 requests to each domain: the visitor's IP address, the page they opened and the browser they used. Choose a domain and click View.
Awstats, Webalizer and Analog Stats
These build charts from your server logs: visitors per day and month, most-viewed pages, where visitors came from and which search terms they used. Open one, then click the view icon next to your domain. Awstats is the most detailed. Stats update about once a day, so a new site shows "no domains" until it has had some traffic.
Bandwidth
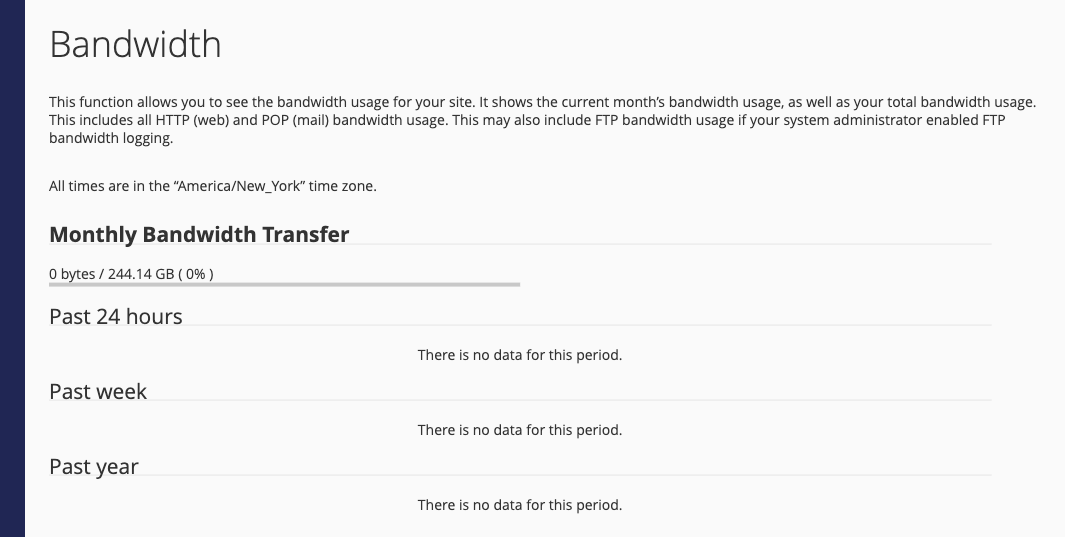
Shows how much data your sites have transferred this month against your plan's monthly allowance, with charts for the past day, week and year.
Errors
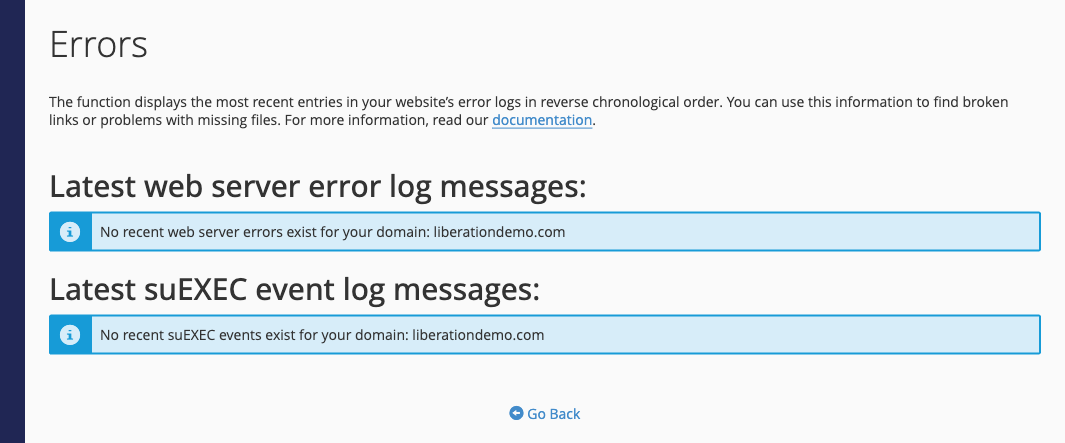
Shows the latest entries in your website's error log, newest first. Check here when a page shows a blank screen or a "500 Internal Server Error": the log usually names the file and line that failed.
Raw Access
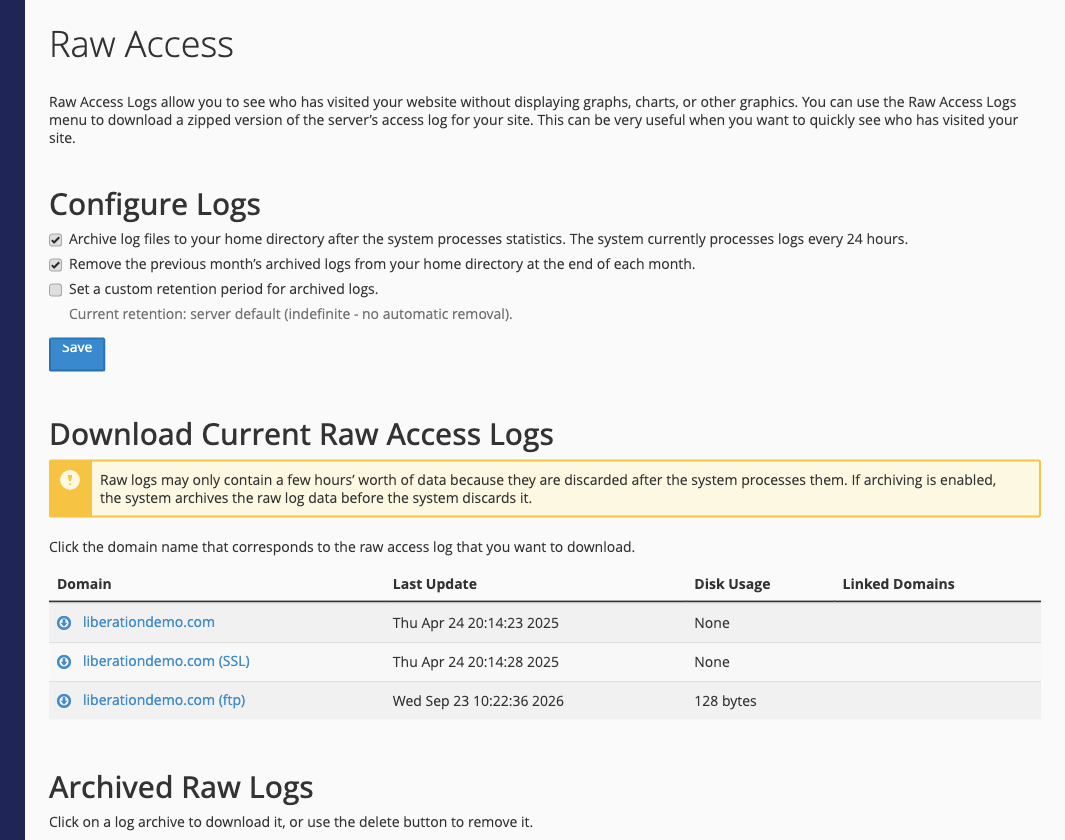
Lets you download your website's raw access logs as compressed files, for example to load into your own analytics tool. Under Configure Logs you can choose to keep archived logs in your home folder and remove last month's archives automatically.
Resource Usage and Site Quality Monitoring
See Check Your Disk Space and Resource Usage and Monitor Your Website with Site Quality Monitoring.